
Figure 2.
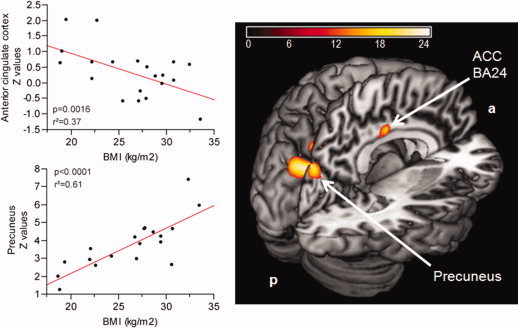
Contrast of DMN between lean and obese subjects. Color map represents significant (P <0.05, FWE) voxels of altered functional connectivity in obese compared to lean subjects. Color bar represents F‐values. The top scatter plot shows significant negative correlation between the right anterior cingulate cortex (BA24) (x = 3, y = −12, z = 36) and BMI, adjusted for fasting insulin levels. The bottom scatter plot shows significant positive correlation between the left precuneus (x = −3, y = −78, z = 33) and BMI, adjusted for fasting insulin levels.