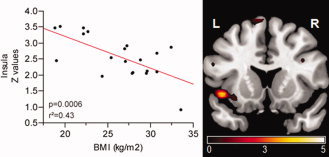
Figure 3.

Contrast of temporal lobe network between lean and obese subjects. Color map represents significant (P < 0.05, FWE) voxels of decreased functional connectivity in obese compared to lean subjects. Color bar represents T‐values. Scatter plot shows significant negative correlation between the left insular cortex (x = −42, y = −6, z = 0) and BMI, adjusted for fasting insulin levels.
