
Figure 3.
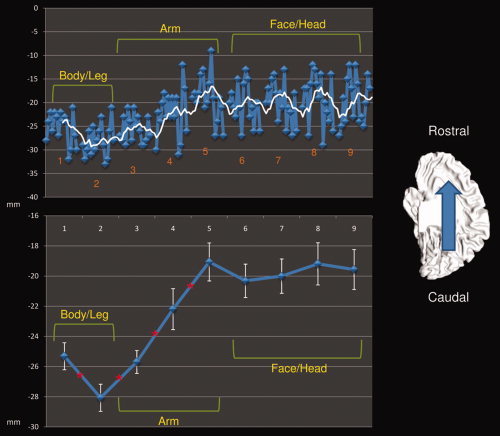
Center of mass rostrocaudal shift of each ROI‐related connected cluster. Upper panel shows the shift over the Y axis of each subject's center of mass (blue line) and the moving mean (white line, mean of 5 consecutive points). Lower panel shows the shift over the Y axis of the mean center of mass (blue line) and the confidence level (white error bar). * Significant differences between two adjacent ROI (P < 0.05). [Color figure can be viewed in the online issue, which is available at wileyonlinelibrary.com.]