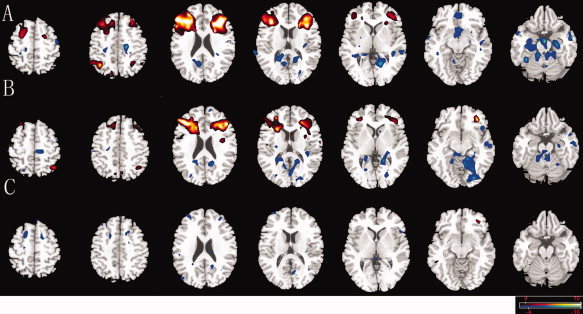
Figure 2.

Comparison of connectivity maps in CCN. Connectivity of the CCN for interictal discharges group (A), non‐discharge group (B), and between‐group differences (C); Networks were identified by seed regions placed in the DLPFC. Decreased connectivity was showed (blue) in DLPFC, IFJ, and pre‐SMA subregions and increased connectivity was found in the left frontal middle orbital gyrus (red). The statistical threshold was P < 0.05 (FDR‐corrected, 20 adjacent voxels). [Color figure can be viewed in the online issue, which is available at wileyonlinelibrary.com.]
