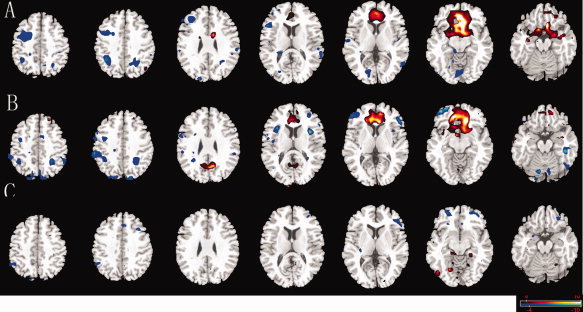
Figure 3.

Comparison of connectivity maps in AN. Connectivity of the AN for interictal discharges group (A), non‐discharge group (B), and between‐group differences (C). Networks were identified by seed regions placed in the ACC. Decreased connectivity was showed (blue) in ACC, VLPFC, and DMPFC. Some regions, primarily the parahippcampus, paracentral area showed increased connectivity (red). The statistical threshold was P < 0.05 (FDR‐corrected, 20 adjacent voxels). [Color figure can be viewed in the online issue, which is available at wileyonlinelibrary.com.]
