
Figure 2.
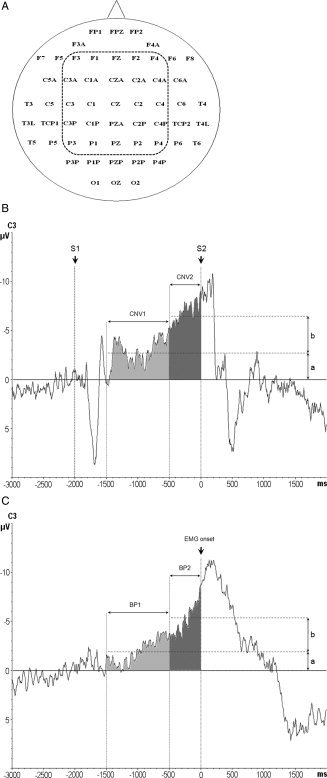
A: The 56 EEG recording electrodes (nomenclature according to the International 10–20 EEG system) and the 25 central electrodes of interest (enclosed by the dashed line) selected for the statistical analysis. B: CNV recordings from electrode C3. CNV1 was determined 1.500–500 ms prior to the go‐signal (S2, time 0 ms) as the mean amplitude of the CNV signal in this time window, indicated by the lower horizontal dashed line with amplitude a. CNV2 was measured 500–0 ms prior to S2, and calculated as the difference b of the mean amplitudes of CNV2 (indicated by the upper horizontal dashed line) minus CNV1. S1: warning signal (2.000 ms prior to S2). C: Representative Bereitschaftspotential (BP) recordings from electrode C3. BP1 was measured 1.500–500 ms prior to the onset of the volitional EMG burst (time 0 ms) of the first movement of the two‐item finger movement sequence as the mean amplitude of the BP signal in this time window, indicated by the lower horizontal dashed line with amplitude a. BP2 was measured 500–0 ms prior to sEMG onset, and calculated as the difference b of the mean amplitudes of BP2 (indicated by the upper horizontal dashed line) minus BP1.