
Figure 5.
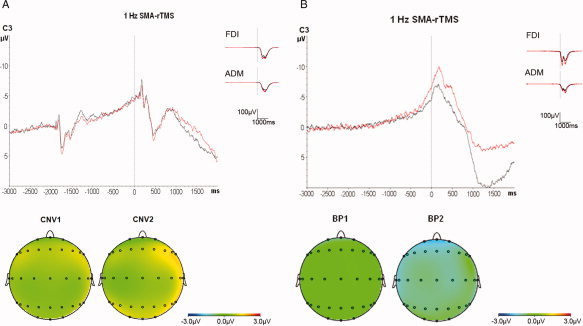
Superimposition of the grand averages of CNV (A, n = 10 subjects) and BP (B, n = 6 subjects) recorded from electrode C3 before (black traces) and after (red traces) 1 Hz SMA‐rTMS (top panels), and scalp potential maps of the CNV and BP (bottom panels). Note the absence of any change in CNV but a significant global increase in BP2 amplitude after 1 Hz SMA‐rTMS. Grand averages of the surface EMG recordings from the right FDI and right ADM show no significant change.