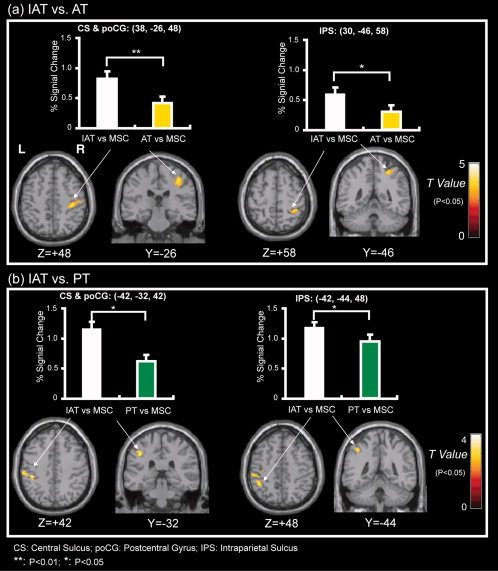
Figure 8.

Across‐subject (n = 23) conjunction activation for IAT–AT and IAT–PT. Areas of significant activation are overlaid on normalized brain slices based on the anatomic T 1 slices. The ROIs in the CS, poCG and IPS were identified for all subjects using the IAT–AT and IAT–PT contrasts. The bar graph above shows the percentage change in BOLD signals between angle stimulation and MSC periods. (a) The main area of activation for IAT–AT. The results show that the right SI and IPS were activated more extensively by IAT than AT tasks. (b) The main activation area for IAT–PT. The results show that the left SI and IPS were activated more extensively by IAT than PT tasks. L, left side; R, right side. [Color figure can be viewed in the online issue, which is available at wileyonlinelibrary.com.]
