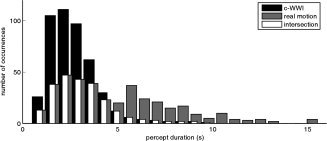
Figure 3.

Distribution of perceptual periods. The distributions of real and illusory motion percepts for one representative subject are shown in grey and black, respectively. Note that, because the duration of real motion percepts was longer, the distribution corresponding to the c‐WWI periods is, on average, closer to the time of perceptual switches (t = 0 s) than the distribution for real motion percepts. In other words, the c‐WWI distribution is associated with more switch‐related activity. To minimize the unequal contribution of switching events to the contrast of c‐WWI versus real motion periods, the two distributions were made comparable to each other by randomly rejecting events that lay outside the intersection of the two distributions (white bars).
