
Figure 1.
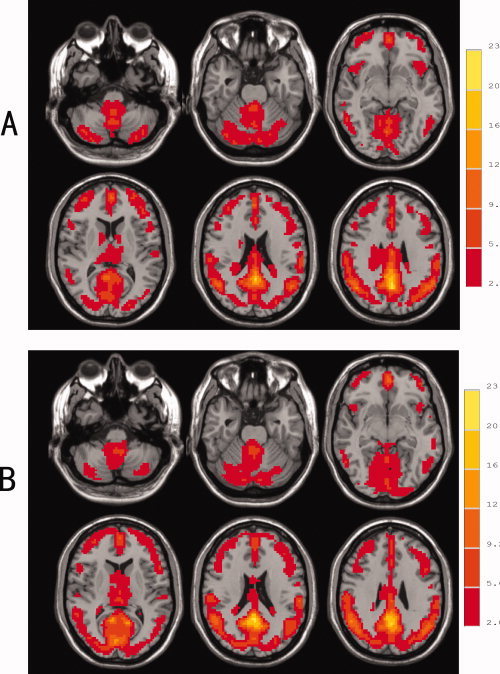
Resting state regional homogeneity (ReHo) maps of healthy controls (A) and SLE patients (B) (P < 0.05, following correction for multiple comparisons). The left side of image corresponds to the right side of the brain (Radiological Convention).