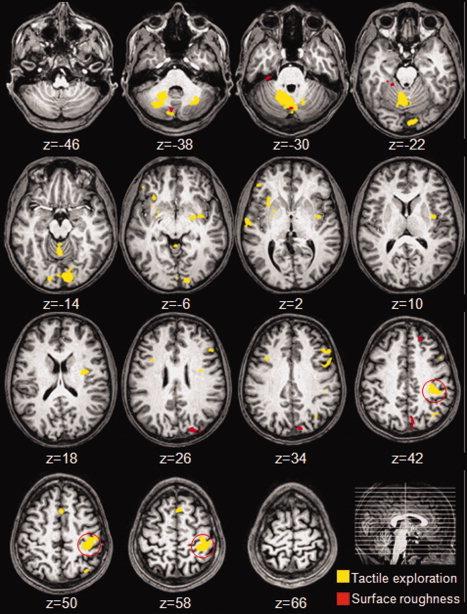
Figure 3.

Axial views of the group‐averaged maps for the significant activations superimposed on the brain of an individual participant. The clusters in yellow correspond to regions showing a main effect for tactile exploration, and the clusters in red indicate a main effect for surface roughness. The red circle surrounds the activation cluster in the left primary somatosensory region which was the only cluster significantly activated for tactile explorations. For all contrasts the statistical threshold applied was P < 0.005 (uncorrected) and for the cluster a threshold of P < 0.05 was applied (corrected for multiple comparisons).
