
Figure 1.
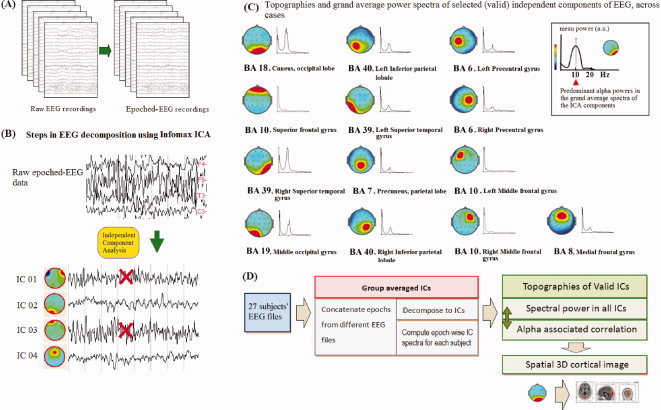
Schematic representation of the different pipeline steps from (A) raw EEG to epoched‐EEG recordings, from a single subject's EEG, (B) EEG concatenation and decomposition using Infomax ICA and artefact rejection, which excludes large amplitudes from muscular activity and eye‐blinking, (C) the construction of mean power spectra of each valid independent component (IC) and its topography. (D) General schema of deriving the alpha power correlation matrices from back‐reconstructed Fourier spectra of all ICs to estimate functional connectivity in both EC and EO states. Then, three‐dimensional cortical images are presented for visualizing related ICs within the cortical source‐level map.