
Figure 5.
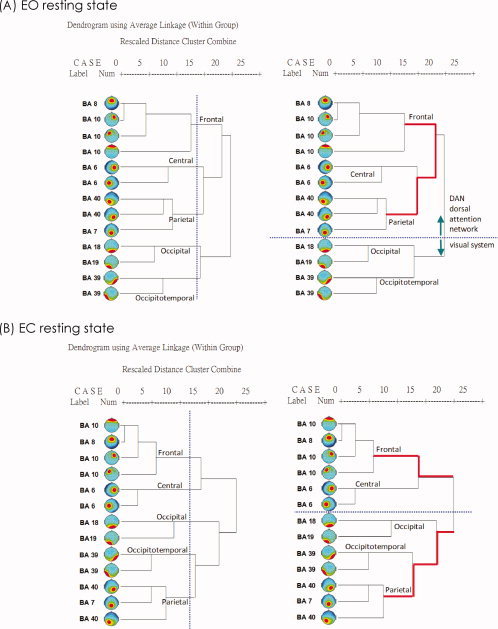
The Dendrogram was performed to illustrate the grouping of the 13 ICs, suggested by Pearson correlations (r values) of alpha power spectra (from 1581 epoches) among all ICs; (A) in the EO condition and (B) in the EC condition (EC, eyes‐closed; EO, eyes‐open; BA, brain regions are identified by putative Brodmann area; vertical blue‐dot lines, instruction lines to help illustrate five groups according to the dendrogram and similarity; horizontal blue‐dot lines, lines to help differentiate the dorsal attention network from the visual system in both states; red lines, indicating the distance (relationship) between the frontal and parietal groups).