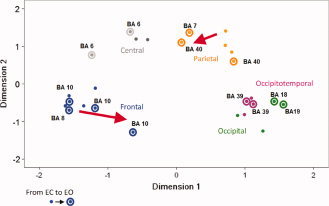
Figure 7.

The Euclidean distances matrix of the 13 ICs in the resting state was visualized in a two‐dimensional space using multidimensional scaling (MDS). Five groups (frontal, central, parietal, occipital, and occipitotemporal groups) were presented by five different color according to the dendrogram and Pearson correlations of 13 ICs (please see Fig. 5). The distance between groups shows their relationship, and the connectivity of frontal and parietal groups is increased from EC to EO state, and the same as the visual system (occipital and occipitotemporal groups).
