
Figure 2.
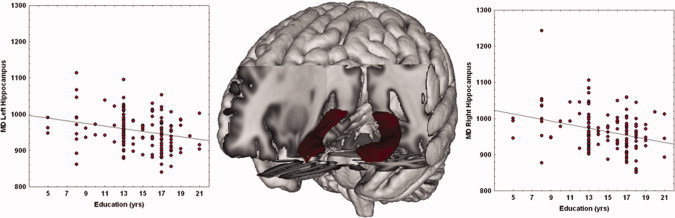
Scatterplot of MD (10−6 mm2/s) and years of education in left and right hippocampi. Linear fit (black lines) is reported. [Color figure can be viewed in the online issue, which is available at wileyonlinelibrary.com.]
Official websites use .gov
A
.gov website belongs to an official
government organization in the United States.
Secure .gov websites use HTTPS
A lock (
) or https:// means you've safely
connected to the .gov website. Share sensitive
information only on official, secure websites.
Scatterplot of MD (10−6 mm2/s) and years of education in left and right hippocampi. Linear fit (black lines) is reported. [Color figure can be viewed in the online issue, which is available at wileyonlinelibrary.com.]