
Figure 1.
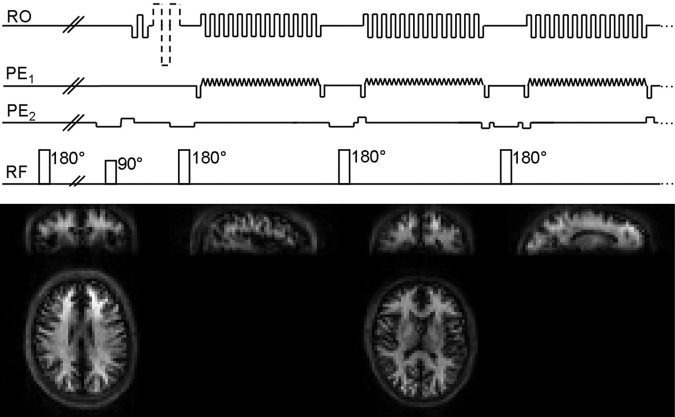
Schematic diagram showing the 3D GRASE VASO sequence (top). Following nonselective blood inversion and slab‐selective excitation, 3D k‐space is covered in a centre‐out fashion along k z to minimize TE; a complete k x–k y plane is acquired per RF interval using an EPI‐like readout. More details of the sequence can be found in a study by Poser and Norris [2009b]. Bottom, sample VASO images from two subjects, showing axial, coronal, and sagittal views at two different positions to demonstrate the acceptable degree of blurring along the secondary phase encoding (head‐feet) direction.