
Figure 3.
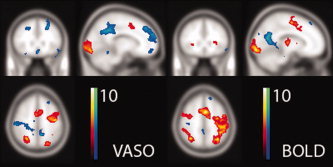
Activation maps from the random effects analysis (N = 12, P < 0.005) of the VASO and GE‐EPI BOLD. At this threshold there are clusters in both methods that are seen in the FFX but not the RFX analysis. In particular, the sensitivity of EPI appears to be compromised in the inferior frontal regions, likely due to its proneness to inhomogeneity artifacts; however, the activations in the central brain are now no longer detected in GRASE. Again, the activation maps are shown at the same position [−12, 26, 52]. [Color figure can be viewed in the online issue, which is available at wileyonlinelibrary.com.]