
Figure 1.
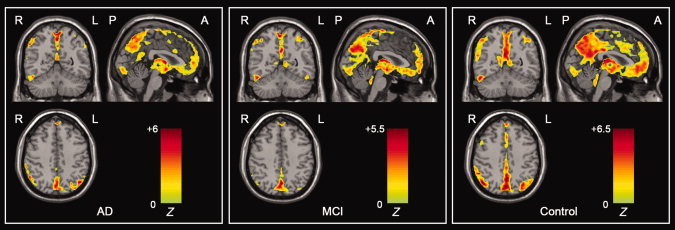
Within‐group ALFF maps within the AD, MCI, and healthy elderly control groups. Visual inspection indicated that the PCC and adjacent PCu had the highest ALFF values within each group and had different strengths among the three groups. The statistical threshold was set at Z > 3.09 (P < 0.001) and cluster size >189 mm3, which corresponded to a corrected P < 0.001. R, right; L, left; P, posterior; A, anterior. [Color figure can be viewed in the online issue, which is available at wileyonlinelibrary.com.]