
Figure 2.
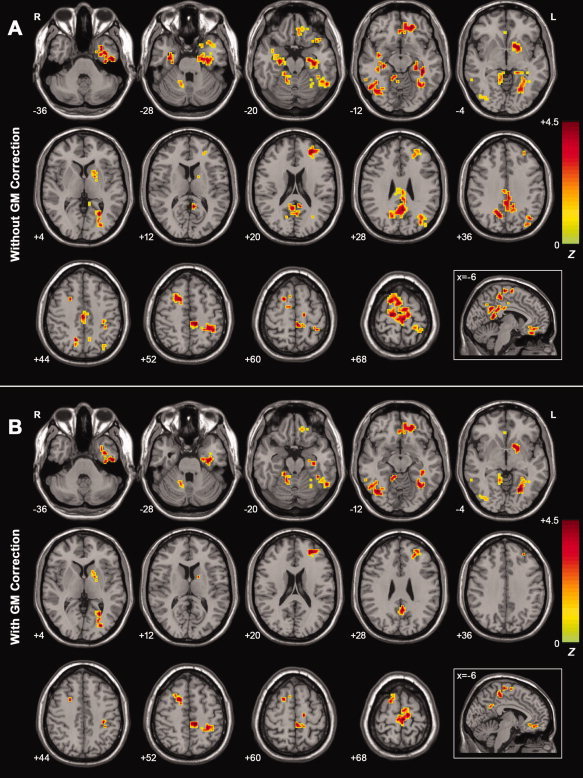
A: Z‐statistical maps among the AD, MCI, and healthy elderly (without GM correction). There were significant ALFF differences among the three groups in the bilateral PCC/PCu, bilateral PHG, bilateral Hip, bilateral ITG, bilateral SFG, bilateral SMA, left IPL, left LN, left FG, left STG, left PCL, left MFG, left MPFC, left OFG, left PoCG, right ALC, and right IOG. For the details of the regions, see Table II. B: Z‐statistical maps among the AD, MCI and healthy elderly (with GM correction). There were significant ALFF differences among the three groups in the bilateral SFG, bilateral SMA, bilateral ITG, left PHG, left Hip, left STG, left FG, left PCL, left LN, left PoCG, left MFG, left MPFC, left OFG, right ALC, and right IOG. Additionally, we also found that there was a cluster in the PCC/PCu that survived the height but not the extent threshold. For the details of the regions, see Table II. The statistical threshold was set at |Z| > 1.96 (P < 0.05) and cluster size >1,404 mm3, which corresponded to a corrected P < 0.05. Of note, we showed the ANCOVA results within a mask showing significant group differences in the ANOVA analysis (Fig. 2A). R, right; L, left. [Color figure can be viewed in the online issue, which is available at wileyonlinelibrary.com.]