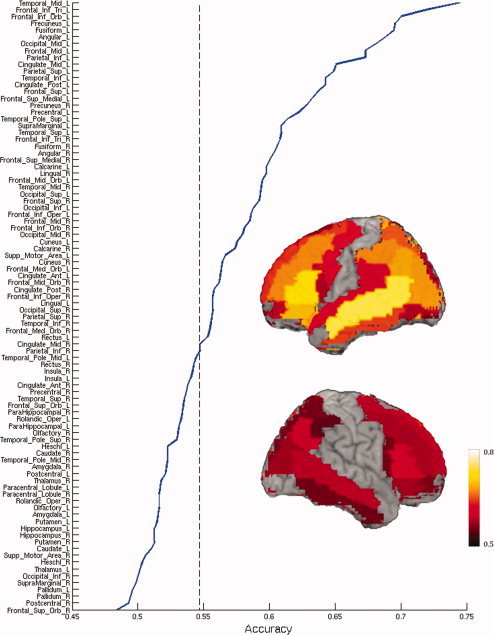
Figure 4.

Mean classification accuracies across participants, for trial identification as abstract or concrete, are shown for each anatomically defined ROI. Regions with significant mean accuracy across participants (P = 0.05) are shown on a surface rendering of a brain template (http://www.cabiatl.com/mricro/mricron/index.html). ROIs are ordered by the mean classification accuracy across participants. The dashed line indicates the threshold of significant accuracy. [Color figure can be viewed in the online issue, which is available at wileyonlinelibrary.com.]
