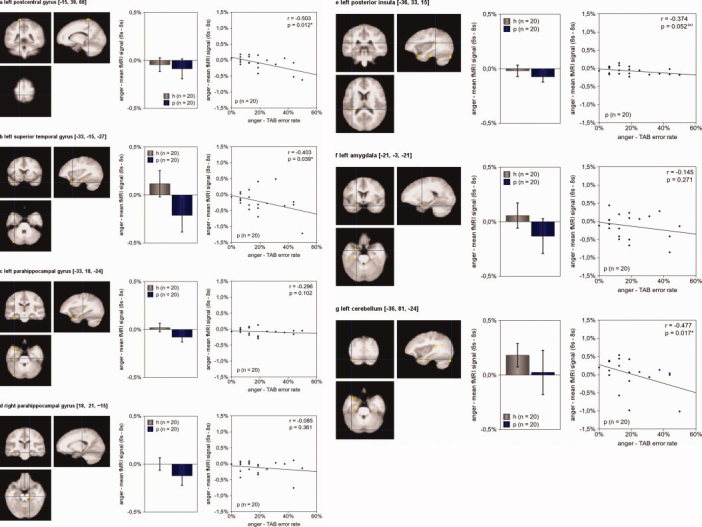
Figure 4.

Brain activity during empathy with angry faces Seven brain regions of somatoform disorder patients showed diminished hemodynamic responses compared to healthy subjects for the contrast “anger” – “control” (P [uncorrected] = 0.001, minimum cluster size 10 voxel): the left postcentral gyrus (a), the left superior temporal gyrus (b), the bilateral parahippocampal gyrus (c, d), the left posterior insula (e), the left amygdala (f), and the left cerebellum (g). Alike Figure 3, the left picture illustrates the exact location of the region of interest. The center picture shows the mean hemodynamic responses of healthy subjects (h, n = 20) and patients (p, n = 20) during empathy with anger. In the right picture, each patient is presented by a dot; its x‐value representing his average error rate in the TAB during anger and its y‐value representing his mean fMRI signal during empathy with anger. Activation maps are superimposed on a normalized mean image of all 40 participants (patients and healthy control subjects). Somatoform patients' TAB error rates during anger predicted diminished hemodynamic responses during anger of three brain regions: the left postcentral gyrus, the left superior temporal gyrus, and the left cerebellum. The more problems a patient had in recognizing anger, the smaller his hemodynamic activity during empathy with anger in those three regions. (The error bars reflect the 95% confidence interval; P‐values are “one‐tailed.”) [Color figure can be viewed in the online issue, which is available at wileyonlinelibrary.com.]
