
Figure 2.
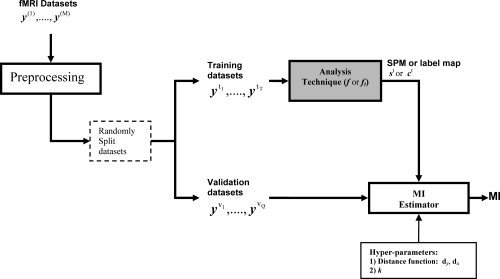
A block diagram of the computational steps for evaluation of the MI performance metric. Available independent datasets of an fMRI experiment (y (1),…,y (M)) are preprocessed and then split into two crossvalidation groups for training and validation. Using the training datasets a SPM, st, or a label map, ct, is estimated. The MI between this estimated map and the validation datasets' time‐series is then calculated as an evaluation metric for the analysis technique applied to the training set. The fixed parameters d y and d x are distance metrics, respectively, between the validation datasets' high‐dimensional time‐series and the lower dimensional SPM/label map spaces, that allow the MI to be calculated. They are used together with a value of k in a k‐nearest‐neighbor‐based estimate of the MI (see text).