
Figure 7.
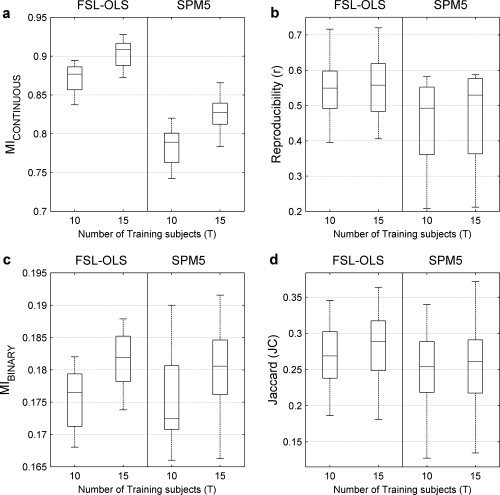
Results from analysis of the perceptual matching task versus fixation analyzed with FSL‐OLS (left column) and SPM5 (right column) in each panel for training groups of T = 10 and T = 15 young subjects: (a) MICONTINUOUS; (b) asymmetric‐reproducibility (r) (see text); (c) MIBINARY for the fraction of positive SPM values, γ = 0.1; (d) the Jaccard metric (JC). The line in the middle of each box–whisker plot is the sample median. All measures use the same leave‐one‐out crossvalidation scheme (see text). MICONTINUOUS and MIBINARY are more sensitive than asymmetric reproducibility and the Jaccard metric in differentiating between T = 10 and T = 15.