
Figure 5.
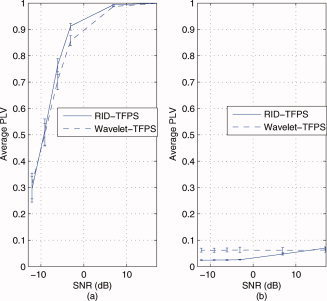
Comparison of robustness of the RID‐TFPS versus the wavelet‐TFPS in noise for a range of SNRs [−12 dB, 17 dB]. A total of 200 simulations with 200 trials are run for each SNR value and for the two types of signals (high synchrony pair and low synchrony pair). The mean and the range of synchrony values (minimum to maximum) over 200 simulations at 8 Hz are shown: (a) between two high synchrony signals (sinusoids in independent white Gaussian noise, x 1(t) = sin(16πt) + n 1(t), x 2(t) = sin(16πt + π/4) + n 2(t))) and (b) between two low synchrony signals (a sinusoid in white Gaussian noise and independent white Gaussian noise, x 1(t) = sin(16πt) + n 1(t), x 2(t) = n 2(t))). [Color figure can be viewed in the online issue, which is available at wileyonlinelibrary.com.]