
Figure 2.
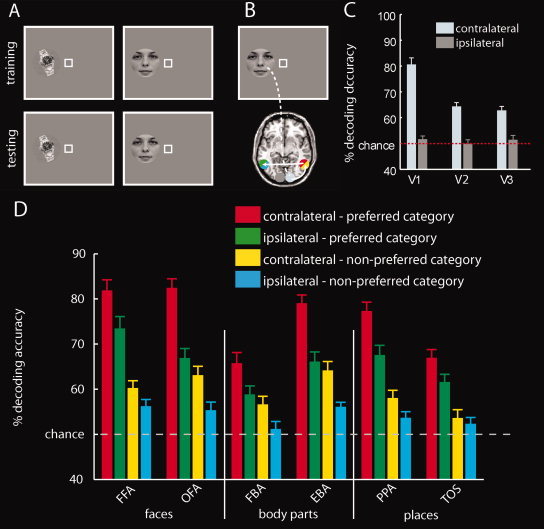
Object classification within location. A: To assess object encoding within location, a classifier was trained and tested pair‐wise to discriminate between activation patterns evoked by different exemplars (A). That is, the location of stimulus presentation (left or right of fixation) was identical for both the training and the test set. B: Illustration of the hypothetical flow of visual object information in the brain. Visual information from the left visual hemifield is fed forward to low‐level visual areas in the right (contralateral) hemisphere exclusively. As visual information is processed further in the visual hierarchy, information from the right (contralateral) hemisphere crosses over to the left (ipsilateral) hemisphere through transcallosal connections. Note that the nodes in the information flow are color‐coded such that the colors reflect the origin of the classification results reported in panels (C) and (D) (e.g., red and yellow for classification results originating from higher order regions contralateral to the hemifield of visual stimulation). C: Category classification within location in low‐level visual areas. All low‐level visual areas show a strong bias for the contralateral visual field. The gray striped line indicates classification chance level (50%). Results show the mean decoding accuracy ± SEM. D: Results of object classification within location in category‐selective regions. All ROIs exhibited category preference. Moreover, all regions except TOS showed a contralateral visual field bias, as indicated by higher category information contralateral than ipsilateral to visual stimulation. [Color figure can be viewed in the online issue, which is available at wileyonlinelibrary.com.]