
Figure 4.
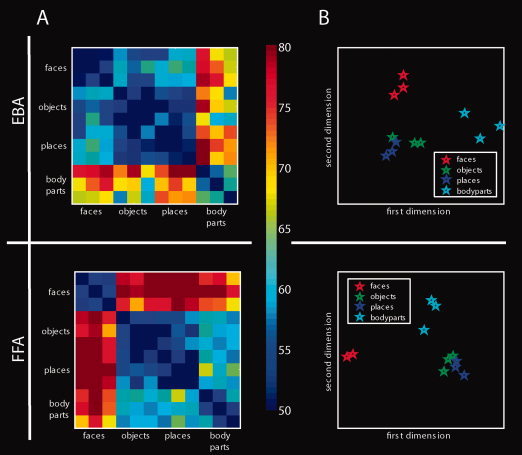
Classification results across locations and MDS. A: Exemplary results of object classification across location in EBA and FFA for all pair‐wise object classifications. Each colored cell in a matrix represents decoding accuracy for classification between two object exemplars (see color bar on the right). B: The right panel displays the location of object exemplars in the space defined by the first 2 dimensions derived by MDS on representational dissimilarity between object exemplars. The results indicate that object exemplars in both preferred and nonpreferred categories tend to cluster together according to category. [Color figure can be viewed in the online issue, which is available at wileyonlinelibrary.com.]