
Figure 5.
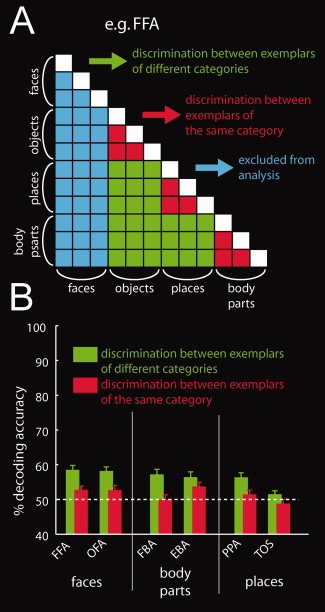
Structure in the representation of nonpreferred categories in category‐selective cortex. A: The matrix represents a schema of decoding accuracy for all possible category pair discriminations. For each region, we excluded all discriminations involving the preferred category (e.g., here all discriminations involving faces in FFA, indicated in blue). Then, we averaged decoding accuracies depending on whether they were the results of discrimination between exemplars from the same category (by red color) or the results of discrimination between exemplars from different categories (green). Note that the matrix is symmetric across the diagonal. Further, the diagonal is undefined as discriminations between one and the same object exemplar were not carried out (indicated in white). B: Location‐tolerant information about nonpreferred categories in category‐selective regions. In nearly all regions, classifications involving exemplars from different categories resulted in higher decoding accuracies than classifications involving exemplars from the same category. This directly indicates a category structure in nonpreferred responses in category‐selective regions. The gray striped line indicates classification chance level (50%). [Color figure can be viewed in the online issue, which is available at wileyonlinelibrary.com.]