
Figure 6.
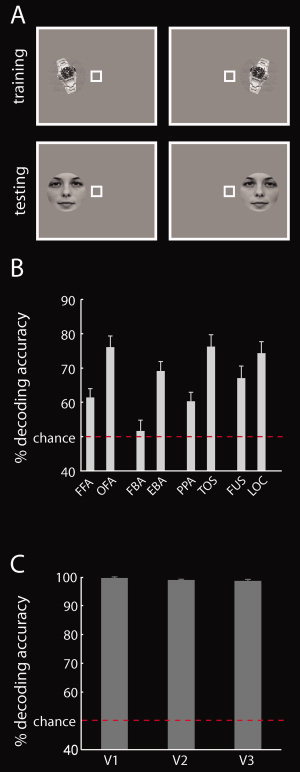
Location classification across objects. A: To reveal location information, a classifier was trained to distinguish between two locations of a specific exemplar. Then, the classifier was then tested on the two locations of a different exemplar. B: Results of location classification across objects in high‐level visual cortex. All regions investigated contained location information. Interestingly, regions on the lateral‐occipital surface of the cortex contained more location information than regions on the ventral‐temporal surface. Results represent the mean decoding accuracy ± SEM. The red line indicates classification chance level (50%). C: Results of location classification across objects in low‐level visual areas V1, V2, and V3. As expected, all low‐level visual areas showed nearly perfect location classification. Results represent the mean over ROIs ± SEM. [Color figure can be viewed in the online issue, which is available at wileyonlinelibrary.com.]