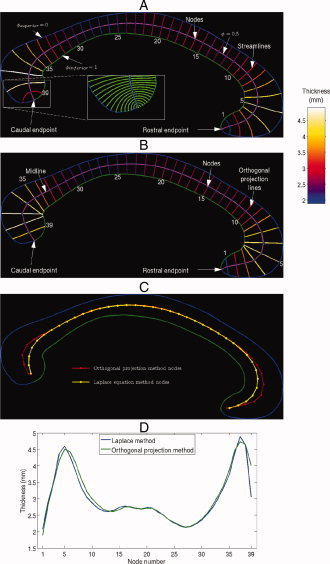
Figure 1.

Laplace equation thickness model (A) and orthogonal projection method thickness model (B) shown on an idealized corpus callosum. The 39 sampled streamlines in (A) and (B) are colored according to callosal thickness and are annotated with their indices, which were chosen to increase caudally. (A) (Inset) Magnification of the streamlines (not colored according to callosal thickness), constructed from a denser sampling of the midline, near the splenium. A comparison of the node locations and resultant regional thickness profiles of the two methods are shown in (C) and (D), respectively.
