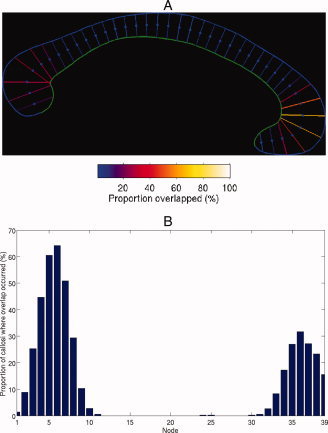
Figure 2.

(A) Idealized callosum with the contours colored according to the number of callosi, as a percentage, in the dataset in which that contour intersected with at least one other contour. (B) Graphical representation of (A) with the non‐intersecting nodes, across the entire dataset, omitted.
