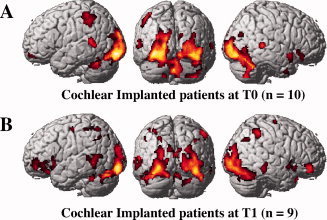
Figure 1.

Brain activation patterns during speech‐reading. A: cochlear‐implant patients at T0 (n = 9). B: cochlear‐implant patients at T1 (n = 8). Speech‐reading elicits auditory activations in cochlear‐implant patients. [Color figure can be viewed in the online issue, which is available at wileyonlinelibrary.com.]
