
Figure 2.
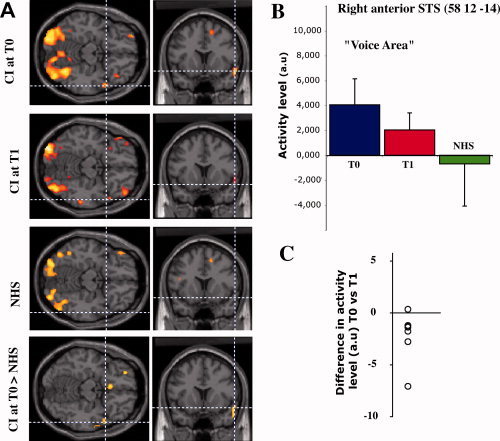
Activity in the voice identity area during speech‐reading. A: activation patterns for each subject group and differential activation pattern between patients at T0 and NH controls. B: normalized regional cerebral blood flow (arbitrary units) in the right anterior superior temporal sulcus for each subject group. Activity level in the voice identity area decreases with the auditory experience, being high for inexperienced cochlear‐implant patients, and low for NH controls. Panel C shows the individual differences of activity between T0 and T1 (7 paired comparisons; the single outlier is a different patient than the one in Fig. 3C).