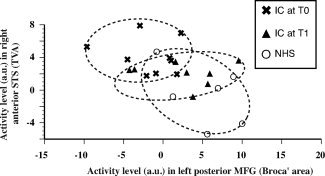
Figure 5.

Relationship between activity levels in the voice identity area and Broca's area. At the population level there is a negative correlation (P = 0.0093) between normalized regional cerebral blood flows (arbitrary units) in the voice identity area and Broca's area. Inexperienced cochlear‐implant users display high activity in the voice identity area and low activity in Broca's area. While this is the reverse in NH controls, experienced CI users display intermediary activity levels in both areas.
