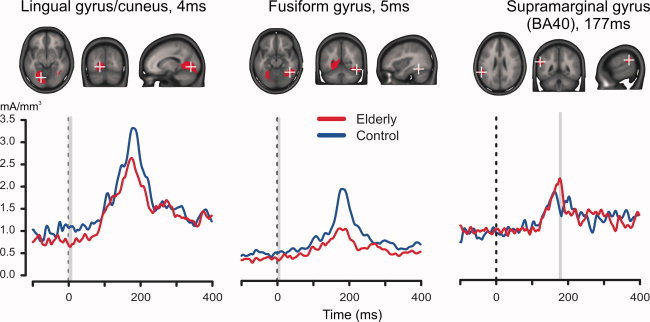
Figure 5.

Aging effects in the Short SOA condition. Each of the three upper panels shows in red the areas with statistically significant differences (FDR = 0.05 corrected). Peri‐stimulus decreases were observed in the left lingual gyrus and parts of the cuneus (left panel), and in the right fusiform gyrus (middle panel). A stimulus‐evoked increase for elderly was observed in the left inferior parietal cortex (right panel). The lower three plots show the corresponding current density timeseries at the regional source‐point with minimal P‐value. The black line indicates stimulus onset, the gray bars mark latencies of significant differences. [Color figure can be viewed in the online issue, which is available at wileyonlinelibrary.com.]
