
Figure 3.
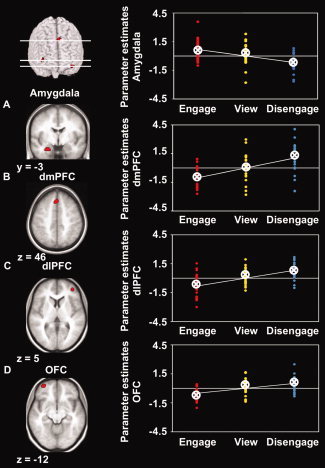
Statistical parametric maps (SPMs) (left) and individual mean parameter estimates (right) of brain activity during engagement, viewing, and disengagement in regions of interest. A: Significant linear increase of activity during engagement (contrast engage‐view‐disengage) in the left amygdala. B–D: Significant linear increase of activity during disengagement (contrast disengage–view–engage) in the dorsomedial prefrontal cortex (dmPFC) (B), dorsolateral prefrontal cortex (dlPFC) (C), and left orbitofrontal cortex (OFC) (D). SPMs are shown with a height threshold of T = 3.5, corresponding to P = 0.001, uncorrected, and an additional extent threshold of k = 10 contiguous voxels for the prefrontal cortex, and are overlaid on the participants' mean structural scan. For visualization, the SPM of amygdala activity is masked with the amygdala region‐of‐interest mask derived from the AAL toolbox. Each dot depicts one participant's mean parameter estimate for the specific condition at the peak voxel of the respective region. Lines represent linear fits. Circled crosses represent group means. [Color figure can be viewed in the online issue, which is available at wileyonlinelibrary.com.]