
Figure 1.
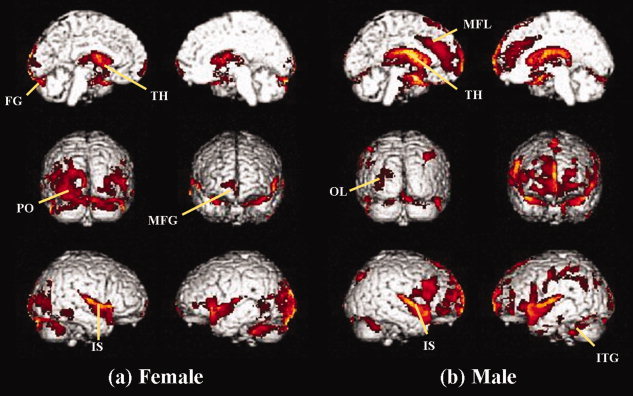
Negative correlation with aging. Statistical parametric maps show the area where the gray matter concentration was negatively correlated with aging in females (a) and males (b) (P < 0.01, uncorrected). The bilateral insula, thalamus, cingulate, medial frontal, and medial occipital gray matter densities showed a significant negative correlation with aging in both female and male groups. FG, fusiform gyrus; IS, insula gyrus; ITG, inferior temporal gyrus; MFG, middle frontal gyrus; MFL, medial frontal lobe; OL, occipital lobe; PO, parieto‐occipital lobe; TH, thalamus. [Color figure can be viewed in the online issue, which is available at wileyonlinelibrary.com.]