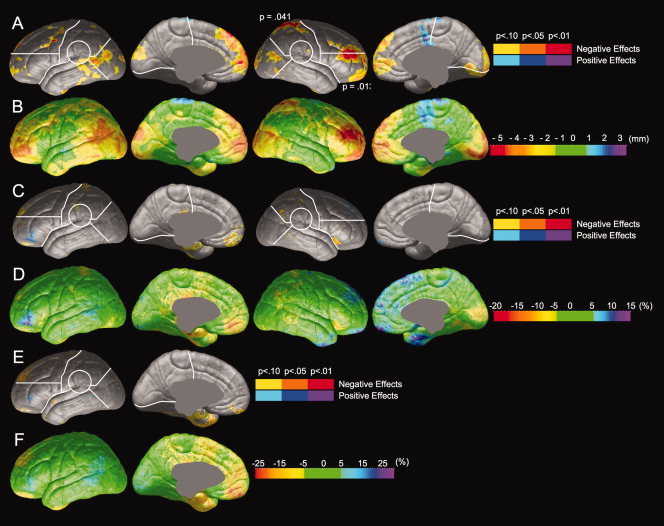
Figure 4.

Comparison of brain morphology between resilient and poor readers. Negative effects (Resilient > Poor) are shown in hot colors, and positive effects (Poor > Resilient) are shown in cool colors. Significance values from permutation tests are shown for each ROI in which group differences were significant by permutation. (A) Statistical comparison of radial expansion between resilient and poor readers. (B) Magnitude of differences in radial expansion between resilient and poor readers. (C) Statistical comparison of gray matter thickness between resilient and poor readers. (D) Magnitude of differences in gray matter thickness between resilient and poor readers. (E) Statistical comparison of gray matter thickness asymmetry between resilient and poor readers. (F) Magnitude of differences in gray matter thickness asymmetry.
