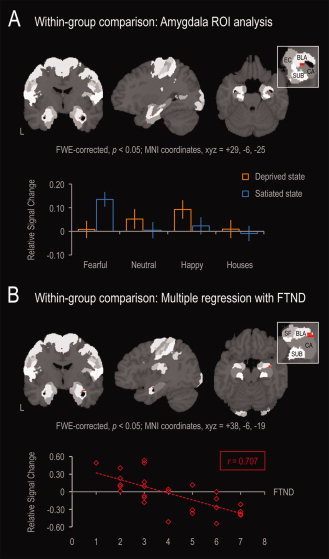
Figure 3.

Results of the within‐group ROI analysis of the amygdala. The amygdala ROI was defined based on cytoarchitectonic maximum probability maps [Amunts et al.,2005; Eickhoff et al.,2005]. Bars represent relative signal change from low‐level baseline. (A) Compared to nonsmokers, satiated smokers exhibited normal amygdala activations to face stimuli, with fearful faces evoking the largest response. The within‐group analysis revealed that smoking deprivation was associated with a selective decline in amygdala activation to fearful faces. (B) Fear responses were lower, the higher smokers scored in the Fagerstöm test for nicotine dependence (FTND), an effect which was probabilistically mapped to the basolateral subregion of the amygdala (BLA). BLA, basolateral amygdala; CA, cornu ammonis; EC, entorhinal cortex; SF, superficial amygdala; SUB, subiculum.
