
Figure 5.
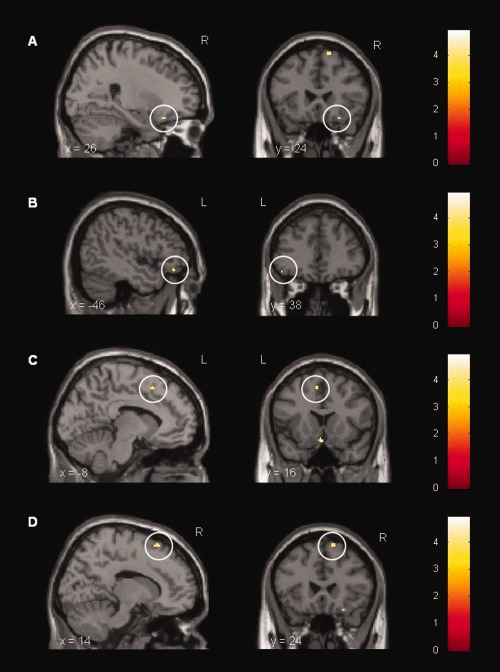
Cortical activation during the presentation of emotional vs. neutral visual stimuli. Paired t‐test computed for the LPSemotional>neutral > placeboemotional>neutral condition. LPS‐treated subjects displayed a stronger activation in (A) right inferior orbitofrontal gyrus ([26, 24, −20], t = 4.39, P < 0.05 based on ROI analysis using SVC with FWE correction), (B) left inferior orbitofrontal gyrus ([−46, 38, −14], t = 3.68, P < 0.001, uncorr.), (C) left medial frontal gyrus ([−8, 16, 50], t = 3.91, P < 0.001, uncorr.), and (D) right superior frontal gyrus ([14, 24, 62], t = 4.16, P < 0.001, uncorr.) after administration of 0.4 ng/kg E. coli endotoxin (n = 18).