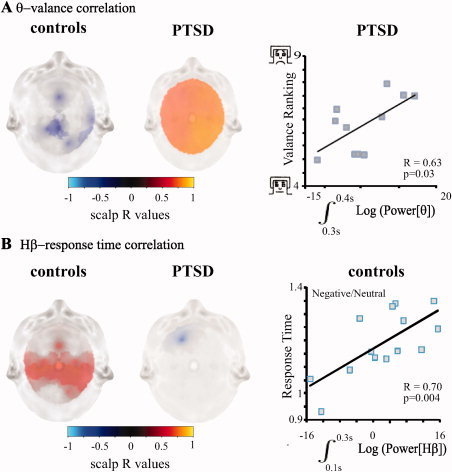
Figure 3.

Behavioral correlates of the frequency response. A: Scalp maps of correlation between θ (negative to neutral ratio) and valence ranking of negative stimuli; R values with a P‐value < 0.05 are presented. Time windows with maximal correlation are presented for controls (left, the 400–500 ms post‐stimulus interval) and PTSD (center, the 300–400 ms interval). An example of correlation in the 300–400 ms interval in the right parietal region is shown for PTSD (right; one extreme value was removed from figure, correlation with this value was higher: R = 0.84; P = 0.0006). B: Scalp maps of correlation between the negative to neutral ratios of Hβ activity in the 100–300 ms interval and RTs; R values with a P‐value < 0.05 are presented for controls (left) and PTSD (center). An example of correlation in the 100–300 ms interval in the left central scalp region for controls is shown (right).
