
Figure 5.
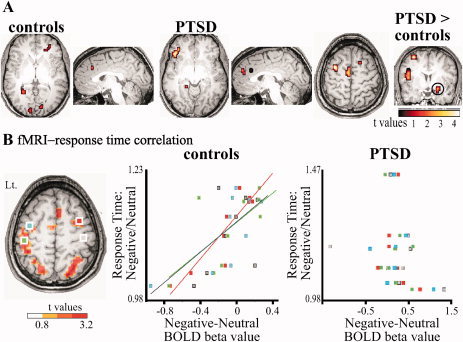
fMRI analysis points to anatomical regions of emotion‐related activity. A: MRI BOLD signal analysis for the contrast negative‐neutral in control, PTSD and for the contrast PTSD negative‐neutral versus controls negative‐neutral. Encircled is the amygdala. B: Correlation between the difference in individual negative versus neutral mean BOLD activation and ratio of negative/neutral RT in left premotor (blue), left motor (green), right premotor (red), and right motor (gray) regions (left, regions for analysis were extracted from the contrast: all pictures vs. fixation,) presented for controls (center) and PTSD (right). For all fMRI analysis shown in this figure, P < 0.01 uncorrected, cluster size > 5 voxels.