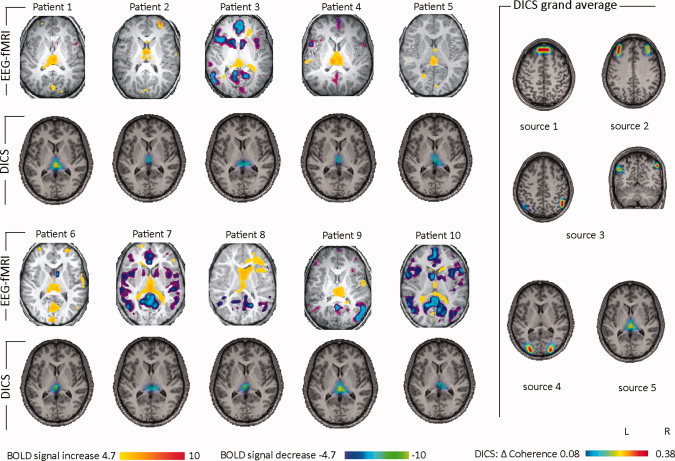
Figure 1.

EEG‐fMRI and DICS analysis of absence seizures. EEG‐fMRI results and DICS sources (frequency band 2–5 Hz) in the thalamus for every patient are listed. Please note that all patients show thalamic involvement in both analyses. In the right of the figure, the grand averages across all patients and for all DICS sources are shown.
