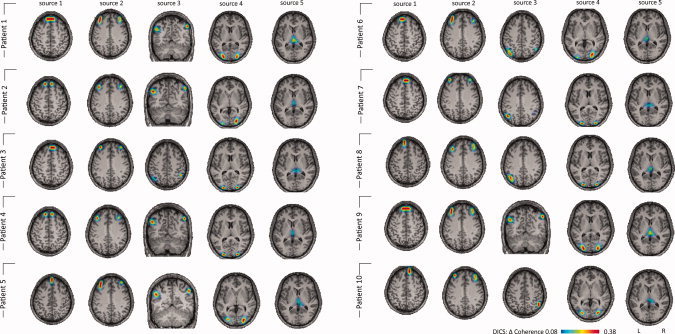
Figure 2.

Single‐subject DICS analysis of absences. DICS sources (frequency band 2–5 Hz) for every patient are listed. Please note that all patients show the same sources, with only slight variation of the local maxima of the sources. Patients 7, 8, and 9 show a unilateral third source; in Patients 2–7, source 6 is found unilaterally.
