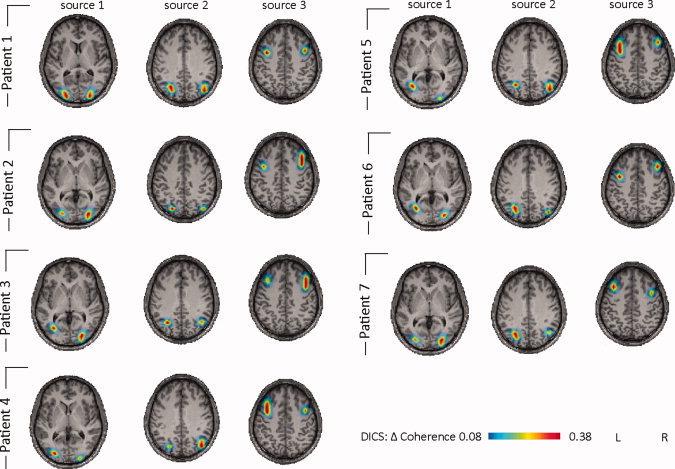
Figure 5.

Single patient DICS analysis of PPR. DICS sources (frequency band 2–5 Hz) for each patient are listed. Please note that all patients show the same sources, with only slight variation of the local maxima of the sources. In Patient 7, the EEG‐fMRI analysis had to be discarded due to artifacts on the EPI images.
