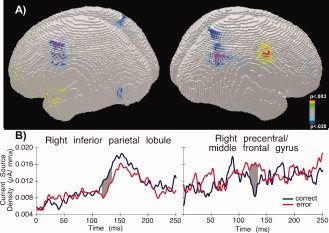
Figure 7.

(A) LAURA inverse solution over the 119‐ to 137‐ms period following target onset depicting the mean difference of source estimations between left correct and left error saccades. Bluish colors: correct > error; reddish colors: error > correct. The right hemisphere is shown on the right side. (B) Current source density in the right inferior parietal lobule (left) and right precentral/middle frontal gyrus (right) as a function of saccade type. Grey area shows interval when significant differences were detected. [Color figure can be viewed in the online issue, which is available at wileyonlinelibrary.com.]
