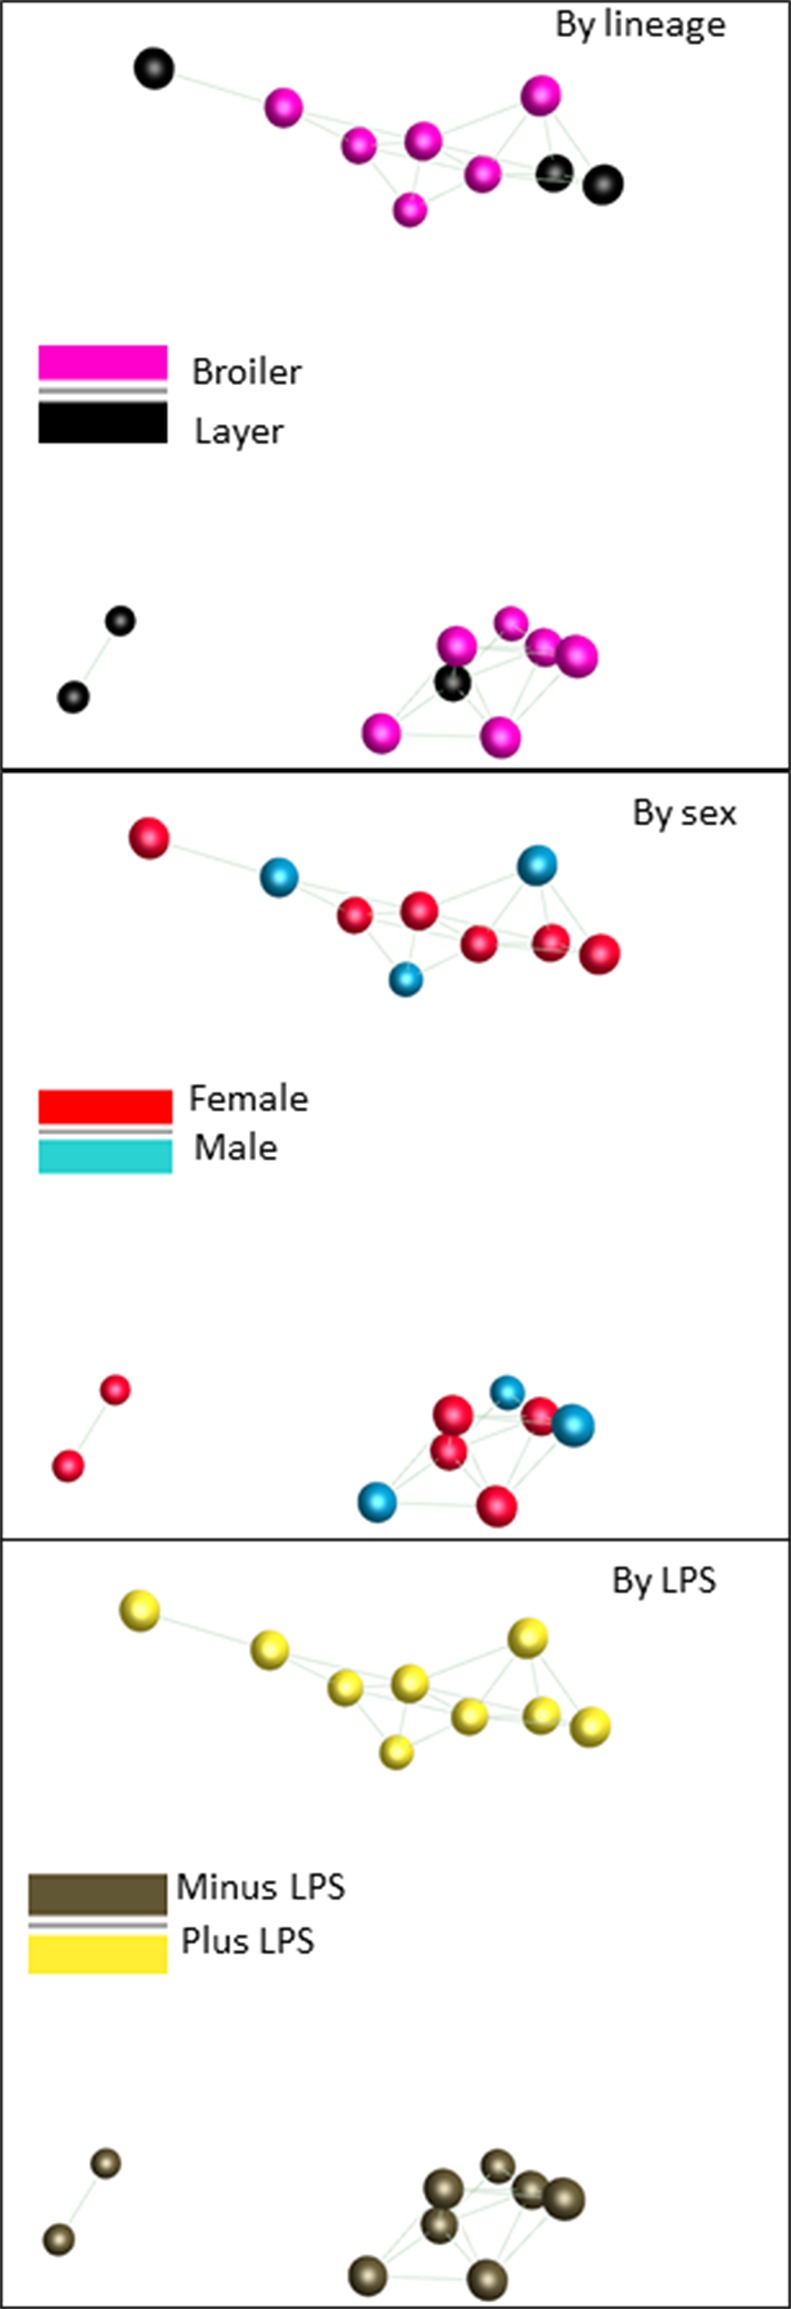
Figure 4.

Network analysis of the response of BMDM generated from adult broiler and layer chickens to LPS. RNAseq gene expression data from BMDM cultured with or without LPS for 24h was analyzed using the network visualization tool Graphia. The panels show the sample-to-sample matrix with a Pearson correlation threshold of 0.97. In the three panels birds are identified based upon breed, sex or treatment as indicated. Note that the samples segregate solely based upon LPS stimulation. The sets of LPS-regulated transcripts that contribute to this separation are summarized in Table S3 .
