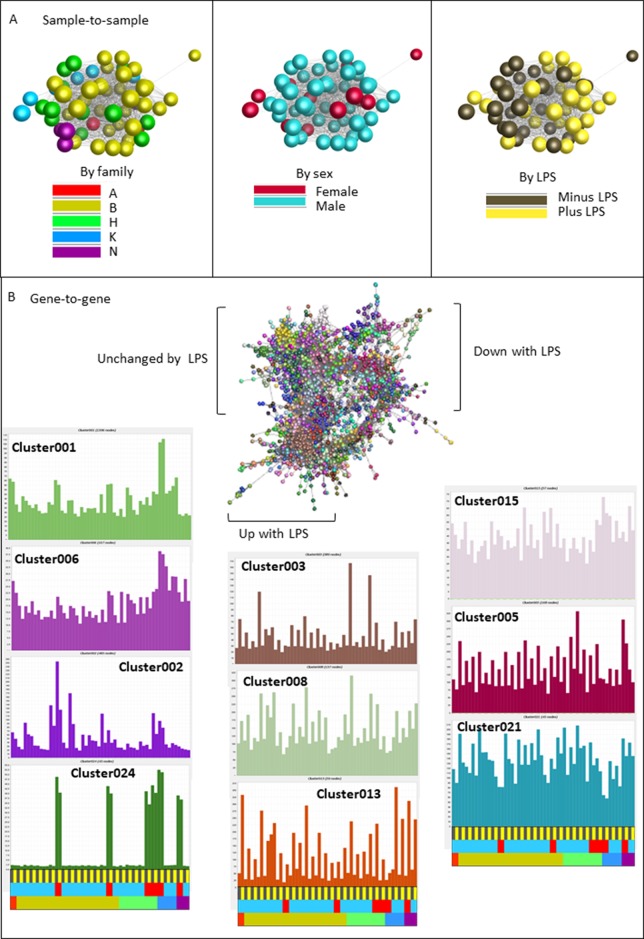
Figure 5.
Network analysis of the response of BMDM generated from F2 inbred hatchling chickens to LPS. RNAseq gene expression data from BMDM cultured with or without LPS for 24h was analyzed using the network visualization tool Graphia. (Panel A) shows the sample-to-sample matrix at a Pearson correlation threshold of 0.97. Note that there is no clear separation based upon family or sex, and less segregation based upon LPS treatment than in the parental comparison ( Figure 4 ). (Panel B) shows the gene-to-gene matrix generated at Pearson r ≥ 0.85 with clusters of co-regulated transcripts colored. This analysis reveals a clear segregation of clusters that are increased, decreased or unchanged by LPS. The average profiles of selected clusters discussed in the text are shown in the surrounding histograms. The color code at the bottom of each column indicates LPS versus control in pairs from the same birds, sex, or family (colors as in Panel A). The transcripts contained within each Cluster are shown in Table S4 and Table S5 .

