
Figure 6.
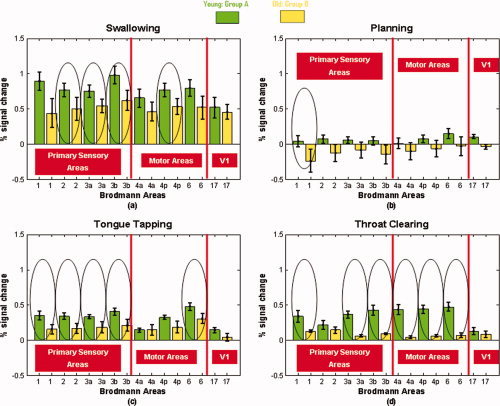
Average % signal change in all ROIs during (a) swallowing, (b) planning, (c) tongue tapping, and (d) throat clearing in both groups. Green = Young adults' activation (Group A); Yellow = Old adults' activation (Group B) circles indicate statistically significant amplitude differences between age groups (P < 0.05). [Color figure can be viewed in the online issue, which is available at wileyonlinelibrary.com.]