
Figure 4.
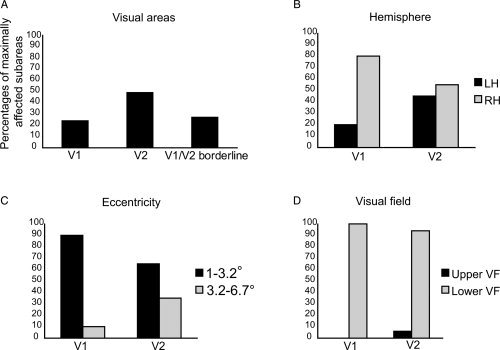
The distribution of the 40 most affected subareas when the position of the coil centre was 2 cm above the inion. The results are averaged from eight participants. A: More subareas with high E‐field were located in V2 than in other cortical areas. B: V1 showed stronger hemispheric asymmetry than V2, with more subareas with high E‐field distributed in the right hemisphere (RH) than in the left hemisphere (LH). C: The most affected regions were more often closer to the fixation in V1 than in V2. D: Almost always the strength of the E‐field was highest in the cortical representation of the lower visual field (VF).