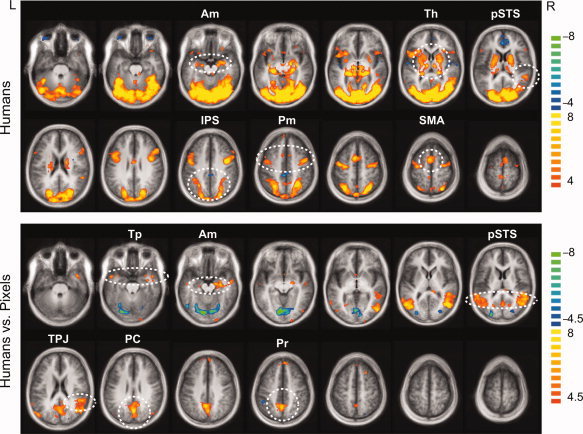
Figure 2.

Spatial distribution of the hemodynamic signals. Top: The main effects of Humans (Toward + Away). Human stimuli activated the amygdala, thalamus, pSTS and IPS, premotor cortex and SMA (encircled). Bottom: Activation was stronger to Humans vs. Pixels e.g. in temporal poles, amygdala, pSTS, TPJ, posterior cingulate, and precuneus (encircled). The statistical maps are overlaid on the anatomical MR image averaged across all subjects; t‐values are given on the right, q(FDR) < 0.005 for main effects and q(FDR) < 0.01 for Humans vs. Pixels. Axial slices from left to right are at the Talairach z‐coordinates of −28, −21, −14, −7, 0, 7, 14 on the first row and 21, 28, 35, 42, 49, 56, and 63 on the second row. The t values are given on the right. Am, amygdala; Th, thalamus; pSTS, posterior superior temporal sulcus; IPS, intraparietal sulcus; PM, premotor cortex; SMA, supplementary motor area; TPJ, temporo‐parietal junction; PC, posterior cingulate; Pr, precuneus.
